Summary
New MiSoC research looking at multi-dimensional approaches bringing methods and data together for better comparison across countries to improve policy.
Introduction
International surveys, such as World Values Survey and International Social Survey Program, were initiated back in the 1980s but were limited to the affluent democracies of Western Europe and North America. Although they have expanded to include countries in Asia, Latin America and Africa, limited coverage over time and space is still a barrier to accumulating cross-national comparative measures on a range of things policy makers care about, for instance protest activity, institutional trust and subjective wellbeing.
Ex-post survey data harmonisation is a useful approach to overcome this problem by creating a single data set, which pools and adjusts variables from different surveys that were not designed to be compared in the first place. However, different question properties in the source survey and survey qualities can lead to inter-survey methodological variability in the process of harmonisation.
In my recent paper, I accessed whether I could meaningfully compare one important attitude–protest potential–across surveys including 107,413 individuals nested within 77 national surveys in 38 country-years using Survey Data Recycling (SDR) framework.
Survey Data Recycling framework
The SDR framework offers a solution to the methodological errors in the harmonisation process by creating harmonisation and survey quality control variables that measure potential sources of inter-survey variability.
Harmonisation control variables measure a difference in the formulation of harmonised questions. Here are three different source questions about joining demonstrations:
A. Eurobarometer 62.2 (2004)
Which of the following, if any, have you done during the last
twelve months?
6. Taken part in a lawful public demonstration
7. Participated in illegal protest activities
B. World Values Survey Wave 4 (1999-2004)
I’m going to read out some different forms of political action that people can take, and I’d like you to tell me, for each one, whether you have actually done any of these things, whether you might do it or would never, under any circumstances, do it.
V136. Attending lawful demonstrations
C. Afrobarometer Round 2 (2003)
Here is a list of actions that people sometimes take as citizens. For each of these, please tell me whether you, personally, have done any of these things during the past year. If not, would you do this if you had the chance?
D. Attended a demonstration or protest march
The SDR data set provides four harmonisation variables for the different source questions:
- demonstration time measures whether a time frame for when a demonstration occurred falls within the respondent’s lifetime (B) or specific past years (A, C);
- demonstration extended measures whether the source question asked only about demonstrations (A, B) or mentions other forms of activities, such as marches or sit-ins (C);
- demonstration illegal measures if the question mentions the illegal status of demonstration (A.7) or not (A.6, B, C); and
- set of questions measures if the survey has a single question about demonstrations (B, C) or the question is divided into a subset of questions (A).
Another potential source of inter-survey variability is variation
in data quality across surveys. The SDR framework identifies
three dimensions of survey quality:
- quality of computer files measures errors or inaccuracies in computer data files, such as a large amount of missing data and duplicated records;
- quality of documentation indicates the quality of surveys as mirrored in the survey documentation, including the sampling scheme, response rate, questionnaire translation, questionnaire pretesting and fieldwork control; and
- quality of data processing measures contradictions between the description of the data and the data records in the data file, which includes illegitimate variable values, misleading variable values, contradictory variable values, variable values discrepancy and lack of variable value labels.
Main findings
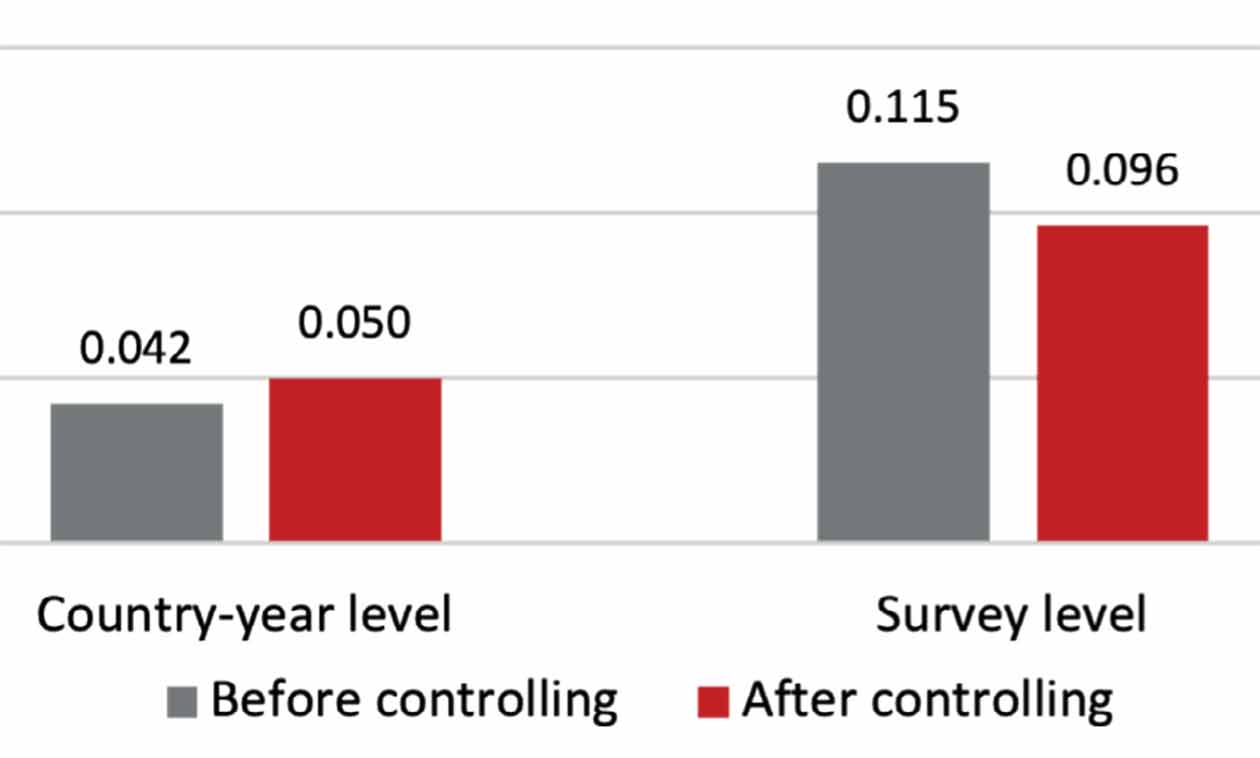
- I examined intraclass correlation coefficients (ICC) of protest potential to test the effects of harmonisation and survey quality control variables. ICC indicates not only the degree of similarity between individuals in the same group but also the amount of individuals’ variation to be explained by the group.
- Figure 1 shows that including these control variables increases the similarity of protest potential among individuals within the same country-year but different surveys by 19.0% (country-year-level ICC) and reduces individuals’ variation in protest potential between surveys in the same country-year by 16.5% (survey-level ICC).
- These findings suggest that adjusting for the question properties and survey qualities improves comparability between surveys – that is, it reduces inter-survey methodological variability in protest potential.
Author’s main message
Research with multiple national surveys should implement control variables that measure differences in the formulation of survey items and variation in data quality across surveys to account for inter-survey variability.
Reference
Kwak, Joonghyun (2021). ‘Measuring and Analyzing Protest Potential From a Survey Data Recycling Framework’. American Behavioral Scientist. doi: 10.1177/00027642211021626.
© MiSoC November 2021
DOI: 10.5526/misoc-2021-007