Prospective students from low socio-economic status (Low SES) or ethnic minority backgrounds who apply to university are less likely to be accepted into high tariff universities than High SES or White students.
Some of these gaps are explained by prior educational performance up to age 16, which also affects choices of qualifications taken between 16 and 18. However, large differences in students’ application decisions, universities’ offers, and acceptances by ethnicity and SES remain even after accounting for any observed pre-application difference in attainment.
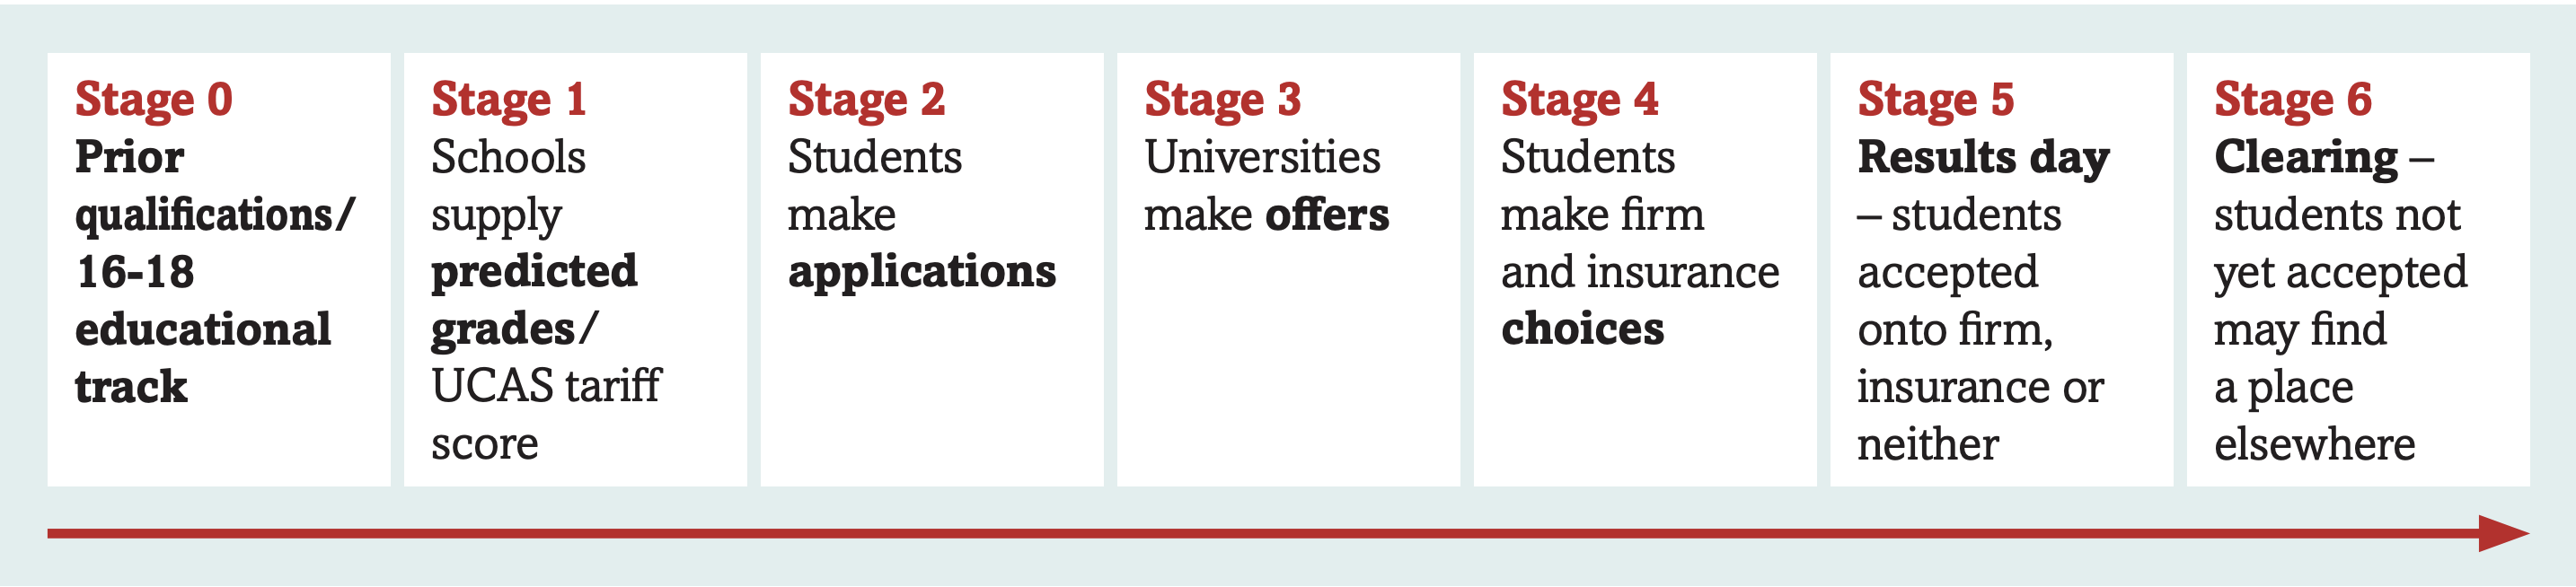
Figure 1 illustrates the stages of the UCAS university application process, from GCSE results to being accepted on a university course, via students’ applications, universities’ offers, students’ firm and insurance choices, whether these lead to a university place on ‘results day’, and if not whether the student goes through Clearing. We look at UCAS applications from the 2017 to 2020 cycles to pinpoint the stages that contribute most to the widening or narrowing of these gaps in normal years, and investigate the impact of Covid-19 on the last two stages in the 2020 application cycle.
Summary
Gaps in access to university and to more ‘competitive’ courses (as measured by the UCAS entry tariff) emerge between applicants from different groups at different stages of the UCAS application process.
Low SES students have lower prior educational performance and are less likely to choose an academic educational track (e.g. studying for A-levels or Highers rather than BTECs) than High SES students (Stage 0). They also receive lower predicted grades (Stage 1) and make less ‘ambitious’ applications (as measured by the difference between the course entry tariff and the student’s own predicted grades) even after accounting for these earlier disadvantages (Stage 2). Consequently, Low SES applicants are less likely to access high tariff institutions and courses.
Black students have lower prior educational performance and are less likely to choose an academic educational track than White students (Stage 0). They receive lower predicted grades (Stage 1), but they suffer an additional disadvantage in that they face a lower probability to receive an offer (Stage 3) or to be accepted on their firm choice (Stage 5) than White applicants for the same course in the same year who have the same prior educational attainment and predicted grades.
South Asian students have similar prior educational performance and are equally likely to choose an academic educational track to White students (Stage 0). They also receive comparable predicted grades (Stage 1). They are more ambitious in their application choices (Stage 2) than White students, but compared with White applicants for the same course in the same year who have the same prior educational attainment and predicted grades, South Asian students face a lower probability to receive an offer (Stage 3) or to be accepted on their firm choice (Stage 5).
Among those not admitted to their firm or insurance choices, Black and South Asian students were historically more successful at finding a place through Clearing than White students (Stage 6). The main impact of Covid-19 on the university admissions process was to reduce their scope to do so. Grade inflation meant fewer unfilled places, with restricted access particularly to low-tariff institutions.
Methods
We use anonymised individual data on applications to universities through UCAS between 2017 and 2020. We combine data on:
- Applicant characteristics, including ethnicity, SES (parental occupation), age group, gender, school type, deprivation, Higher Education participation rates in home neighbourhood, and the date they submitted their UCAS application
- Qualifications achieved at GCSE, and predicted grades for 16-18 qualifications being studied
- Courses and institutions named in their application, and outcomes at stages 3-6 of Figure 1
All the ‘gaps’ we describe here refer to regression coefficients from separate models for each admissions cycle (2017-2020) representing the difference between Low SES and High SES, or between ethnic minorities (Black and South Asian) and White students, conditional on other demographic and educational characteristics known up to that point in the application process.
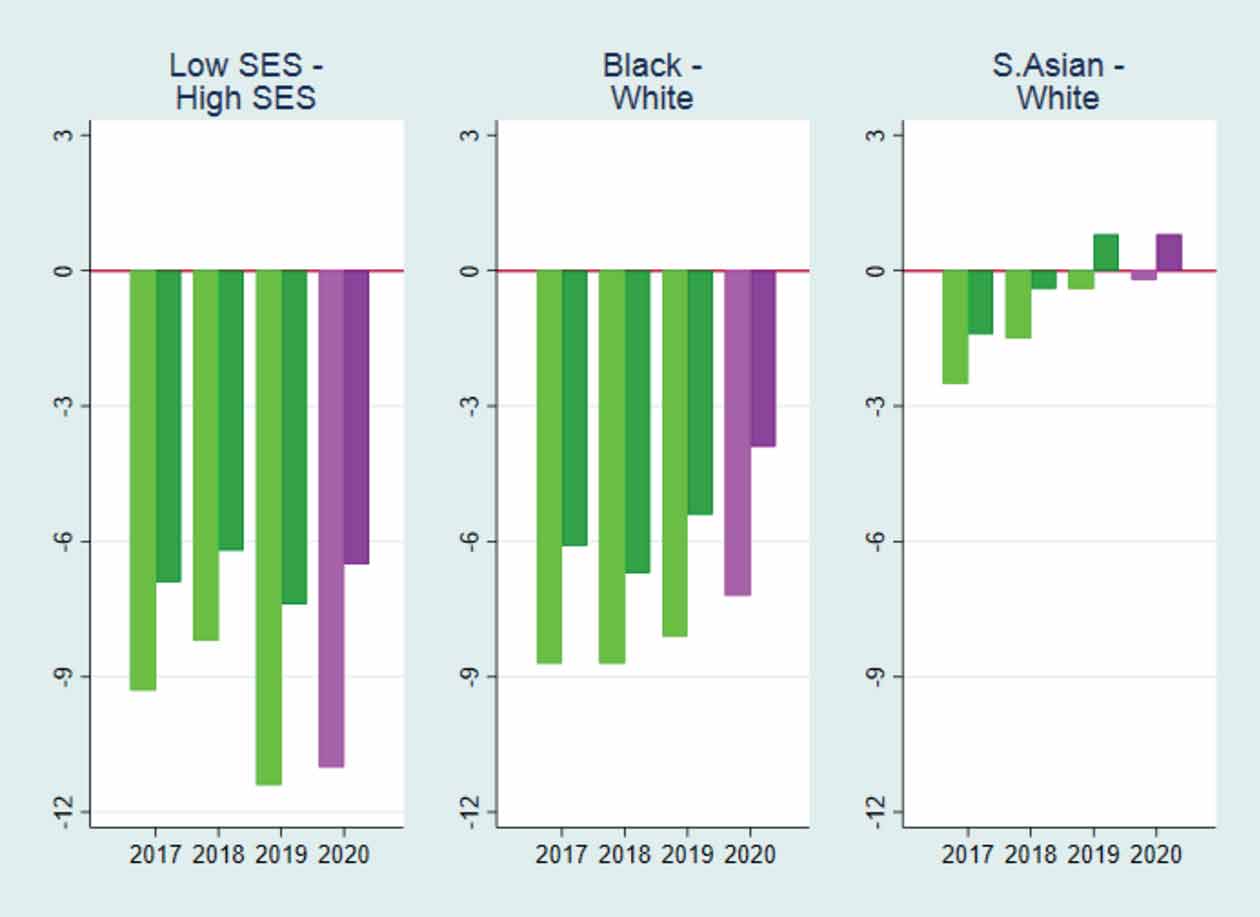
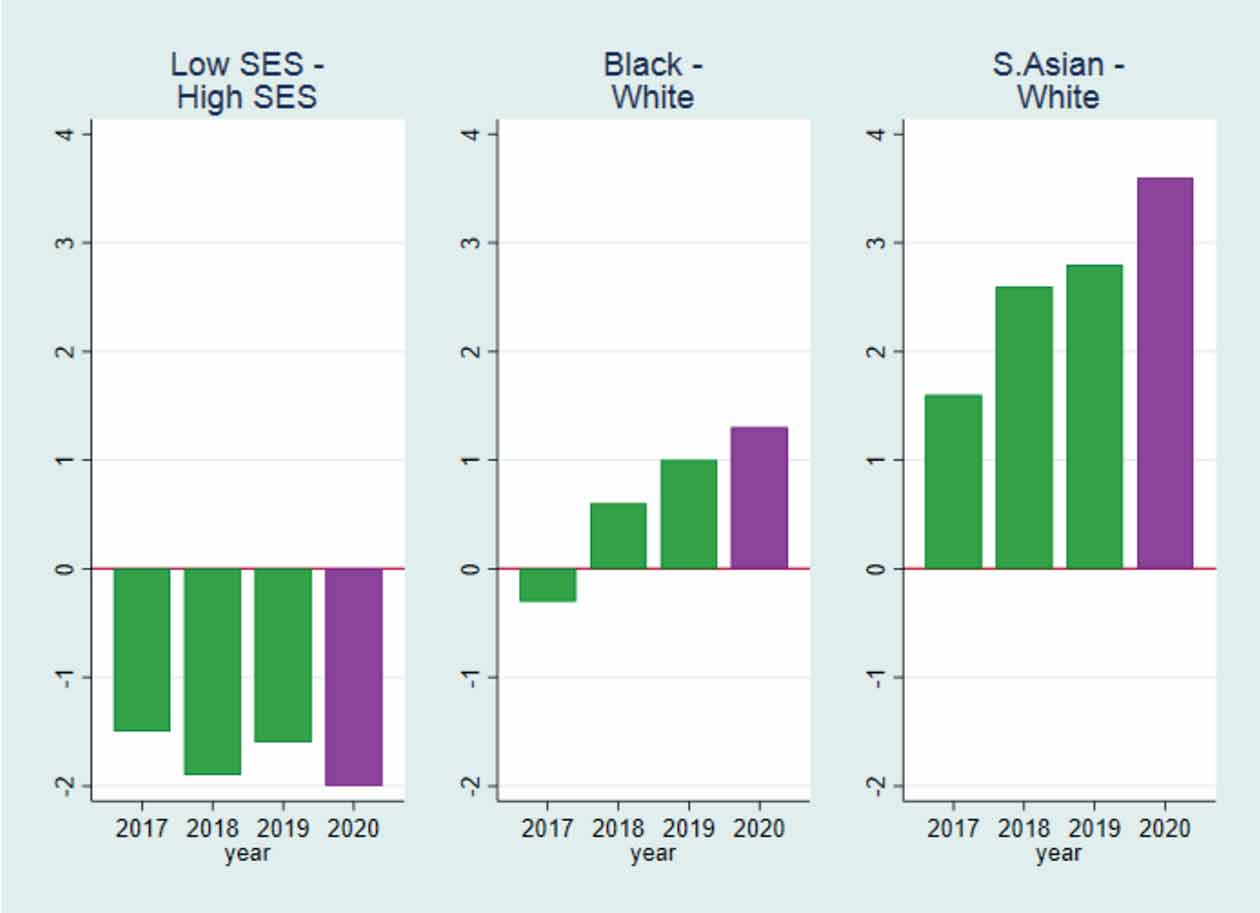
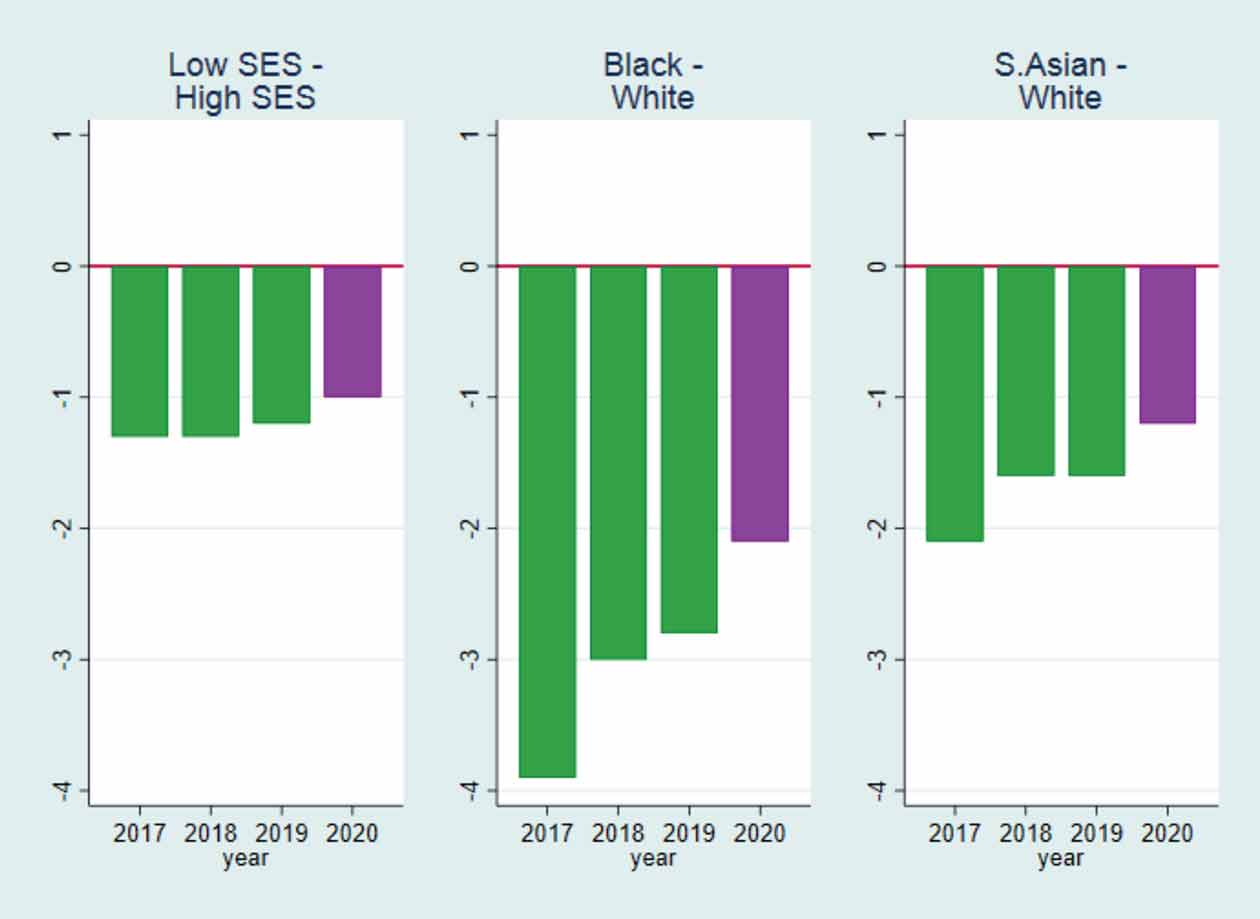
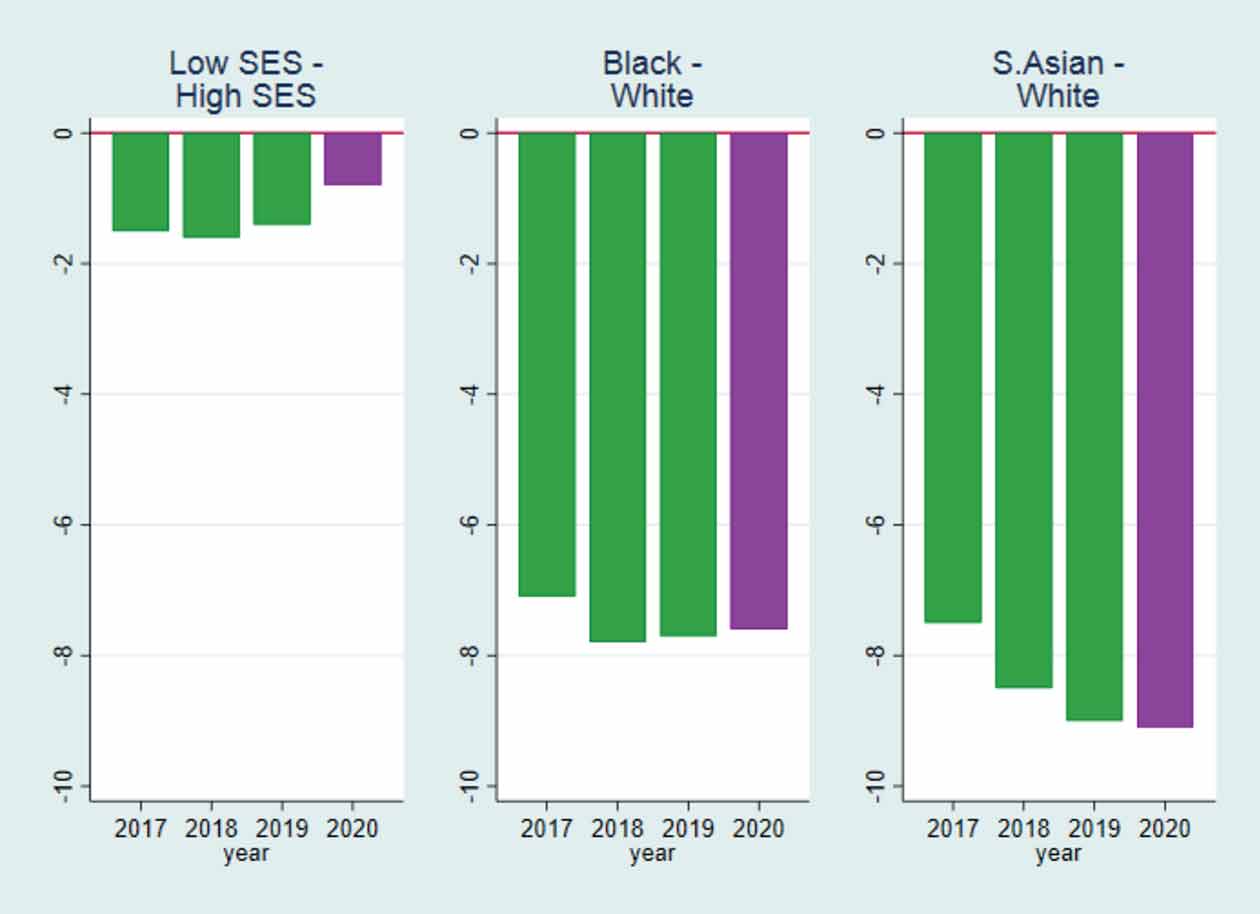
In the graphs below, green bars show the conditional gaps for 2017, 2018, and 2019, and the purple bars for 2020, when later stages of the process had the potential to be affected by Covid-19.
In the analysis ‘Black’ includes all Black African and Caribbean ethnicity applicants, and those of mixed Black and White ethnicity; ‘South Asian’ includes Indian, Pakistani and Bangladeshi ethnicity applicants, and those of mixed White and Indian, Pakistani or Bangladeshi parentage. High SES includes those with a parent in a managerial, professional or intermediate occupation and Low SES those without.
Results
Stage 0
Gaps in educational attainment by SES and between Black and White students are already present in GCSE results. This in turn restricts Low SES and ethnic minority students’ opportunities for 16-18 study. Choices at this stage restrict university possibilities further: Even after accounting for GCSE results, Low SES and Black students are less likely to be studying for at least one A-Level when they apply for university, and among those that do they are less likely to include a ‘facilitating subject’ as recognised by the Russell Group.
Stage 1
Low SES and Black students receive lower predicted grades, converted into UCAS tariff scores in Figure 2.
The gap reduces after accounting for students’ prior performance and choice of educational track (darker bars) than when conditioning on demographics only (lighter bars). The differences are still large: For Black students in 2020, for example, this gap is equivalent to approx. four tariff points, or half an A-Level grade in one subject.
Stage 2
Figure 3 shows that Low SES students apply for slightly less ‘ambitious’ courses (as measured by difference between own predicted tariff, and that of those accepted in the previous year). Black and South Asian students are instead more ‘ambitious’ than White students, and this has been increasing over the past four years. The overall difference is somewhat driven by subject choice, especially related to preferences towards Medicine and Dentistry courses among South Asian students.
Stage 3
Compared with other students with an identical educational record, applying for the same course, in the same institution, in the same year, Low SES, Black and South Asian students are less likely to receive an offer (Figure 4). The overall gap has been closing over the past four years as Black and South Asian applicants receive relatively more conditional offers, but a persistent difference in unconditional offers remains.
This could be due to differences in the quality of references or personal statements, or differences in the ability of applicants to signal skills and potential through extra-curricular experience, for example. We do not have information about these components of university applications.
Differences in unconditional offers received could also be an unintended consequence of targeting other aspects of disadvantage in Access and Participation Plans, such that High SES or White students in low participation schools or neighbourhoods are prioritised over Low SES or Black applicants in schools or neighbourhoods just missing out on this designation.
Stage 4
Black and South Asian students are 6-13 percentage points less likely to choose an unconditional offer as their firm choice. Low SES students make less ambitious firm choices than High SES students, and South Asian considerably more than White students. This is in line with differences in the entry tariff of courses applied for shown in Figure 3.
Stage 5
Black and South Asian students are 7-9 percentage points less likely to be accepted onto their firm choice than other students with identical prior educational records and holding a firm choice with the same course in the same year (Figure 5). The gaps are in the same direction, but smaller in imagnitude, for insurance choices (not shown).
This is because Black and South Asian students are (i) less likely to hold an unconditional offer, and (ii) are less likely to meet the conditions of their conditional offers on results day.
Data containing both predicted and realised grades would be needed to investigate whether Low SES or ethnic minority students who miss the conditions of their offer are any more or less likely to be accepted than High SES or White students with the same grades.
In 2020, the overall rate of acceptance onto firm choices rose 3%pts from 75 to 78%. The rate of acceptance onto insurance choices fell by 3%pts from 33 to 30%. Despite these changes, on aggregate gaps in these outcomes were very similar to or on trend with earlier years. This implies that on aggregate teacher-assessed grades differentiated between students with different characteristics in very similar ways to standard exams.
Stage 6
In usual years, ethnic minority students were more successful at finding a place through Clearing than White students. In terms of access to any university course, this substantially offset inequalities from earlier in the process. It should be noted that Clearing is (i) potentially a stressful process and (ii) could reduce attachment to the institution and course of study. So, finding a place through Clearing rather than earlier on in the process might increase the risk of subsequent dropout.
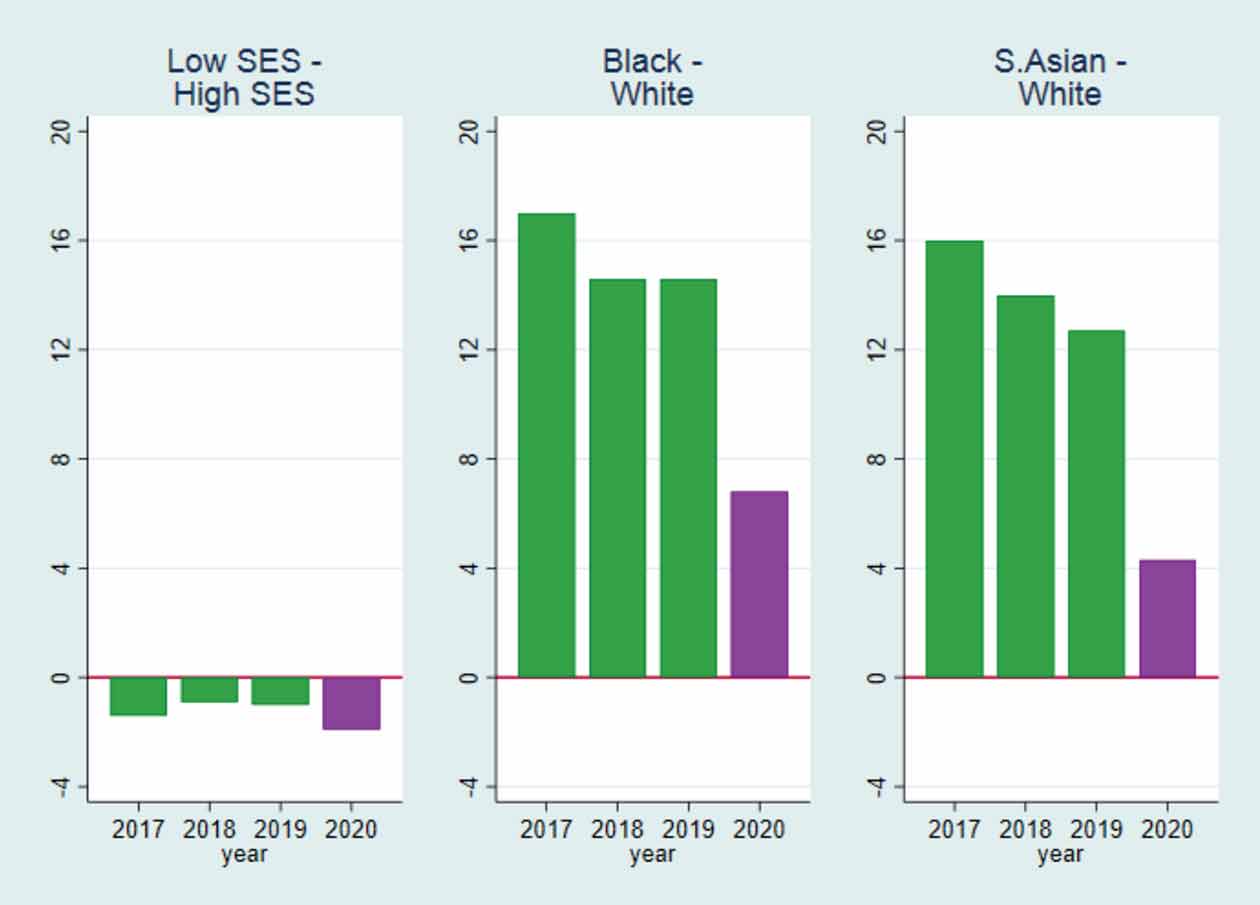
For the 2020 Covid-19 cohort, grade inflation due to CentreAssessed Grades meant there were fewer unfilled places available to those who sought a place through Clearing. This significantly reduced the scope of Black and South Asian students to make up for their lower likelihood of attaining their firm choice (Figure 6). Overall rates of acceptance improved for all SES and ethnic groups, but by less for Black and South Asian students than others. Further analysis shows that lack of Clearing spaces widened the access gap by reducing Black and South Asian students’ access to courses at low tariff institutions.
| Finding | Message for policy |
|---|---|
| There are large negative ethnic and SES gaps in age16 attainment and 16-18 educational track and subject choices. | Gaps in attainment at age 16 and 18 require improved resourcing and intervention to target attainment gaps throughout the school system. Gaps in educational track and subject choices for 16-18 study that exist even after controlling for prior performance require improved information, advice and guidance on the prerequisites or facilitating subjects and qualifications for different university courses. |
| Black and South Asian students are less likely to receive an offer, even compared to those with the same educational record, applying for the same subject and institution. |
More data and research are needed on causes and solutions. Schools could consider whether there is a deficit in the quality of references or support in writing personal statements. UCAS could reconsider ‘masking’ of applicant names to admissions tutors, or removing or reforming the structure of personal statements. Universities could consider whether these gaps are an unintended consequence of Access and Participation Plan focusing on other measures of disadvantage. |
| Black and South Asian students are much less likely to be accepted on to their firm choice. | This requires improved support from schools to convert predicted into realised grades.
A move to post-qualification applications will not help address this reason for the gap in access. |
| The main group in the first Covid-19 cohort to lose out from the revised arrangements consisted of those who would usually find a place through Clearing.
This means Black and South Asian students were disproportionately affected. |
This highlights the importance of contingency plans to ensure students can complete their coursework, exams and assessments in future. The pandemic has highlighted the importance of Clearing for Black and South Asian students. Clearing is potentially stressful per se and may lead to weaker attachment to the course or institution attended. UCAS and universities should work on ways to reduce the importance of Clearing in the application process. Examples to explore include a post-qualification applications system, options for students to apply for and rank a greater number of courses on which they are accepted, or information campaign or ‘nudge’ within the application system to encourage a ‘safe bet’ application and insurance choice. This could emphasise the variability of exam results and how many students miss the conditions of their firm and insurance choice. A more prescriptive approach could be to extend restrictions on the combinations of courses students can apply for (e.g. students can apply to either Oxford or Cambridge, and this could be extended to include more institutions), to increase the likelihood of acceptance on to the ‘insurance’ option. More work would be needed to determine the feasibility and consequences of these options. |
This work was produced using statistical data from ONS. The use of the ONS statistical data in this work does not imply the endorsement of the ONS in relation to the interpretation or analysis of the statistical data. This work uses research datasets which may not exactly reproduce National Statistics aggregates. This work was funded by the UKRI COVID-19 Rapid Response grant ES/V015222/1 ‘Mind the Gap: Educational Inequalities during Covid-19’ with support from the ESRC Research Centre on Micro-Social Change (MiSoC) under grant ES/S012486/1.
DOI: 10.5526/misoc-2021-008 © ISER November 2021
Explainer Download