Child overweight and obesity is a worldwide public health problem which has serious implications for children’s health throughout their lives as well as causing significant healthcare and indirect productivity costs.1 Children consume around one-third of their food energy at school. This means that school meal provision is a potential policy lever to reduce prevalence of obesity among children, 2 and at the same time to help households with the cost of living.
In previous work we found that providing free lunches to Reception children through the Universal Infant Free School Meal policy significantly reduces bodyweights over the course of children’s first year in school and saves a typical family of four approximately £20 in total on food expenditure per month. In this work we study the longer-run impacts of providing free meals to primary school children by looking at Universal Free School Meal (UFSM) schemes implemented in primary schools, in four local authorities (LAs): Newham (from 2010), Islington (from 2011), Southwark (from 2012) and Tower
Hamlets (from 2014). Comparing changes in outcomes in these LAs with those that do not run UFSM schemes
enables us to evaluate causal effects on bodyweight outcomes at ages 5 and 11, and on household food
expenditure.
Message for policy
Our results show that UFSM schemes reduce the prevalence of obesity among children and help households with the cost of living. Our finding of a cumulative effect over time of providing free meals suggests that starting free meal provision early and maintaining it throughout primary schools would maximise the impact on cutting obesity rates and thereby
contribute to addressing the significant long-term healthcare and indirect productivity costs of obesity. Universal provision throughout primary school wouldalso ensure that all children have access to a meal of high nutritional standards while helping families with school-age children with the cost of living.
Key findings
- Receiving universal free school meals reduces prevalence of obesity by 9.3% among Reception children and 5.6% among Year 6 children on average. This corresponds to a 1.3 and 1.4 percentage points reduction in obesity. These impacts are substantial, given how hard it is to influence obesity through other interventions involving exercise or healthy eating education
- Effects are largest among Year 6 children who received UFSM the longest: the reduction in obesity was 8.4% among children who received them throughout primary school (2.1 percentage points reduction)
- The effect on children receiving UFSM for the first time in Year 6 is smaller than the corresponding effect on Reception children. This indicates that the bodyweights of older children are harder to shift in the short term
- The impact of UFSM is much smaller in schools with pre-existing high prevalence of obesity. These families and schools may benefit from additional interventions
- Families save approximately £37 per month in total on food spending, based on a household with two adults and two primary-aged children. About half of this saving is due to reduced spending on ‘eating out’, which includes takeaways. The reduction in expenditure is smaller than the value of the free meals, suggesting households are consuming a higher value of food in total
Data and methods
For the analysis of bodyweights we use school-level data from the National Child Measurement Programme (NCMP). These data are collected by trained nurses visiting schools to weigh and measure all Reception (aged 4-5) and Year 6 (aged 10-11) children whose parents have not opted them out of the study. Outcome measures are all defined with respect to age- and sex- adjusted growth tables for the UK population in 1990:
- Overweight or obese: BMI above the 1990 85th percentile
- Obese: BMI above the 1990 95th percentile
For food expenditure we use household-level data from Understanding Society, the UK Household
Longitudinal Study (UKHLS), and restrict our sample to households with at least one child aged 0-15.
We estimate impacts on children’s bodyweights and household expenditure using difference-in-difference methods. For bodyweights we use a new imputation method4 and for household food expenditure we estimate a difference-in-difference regression with year, month, and LA fixed effects.
The idea of both methods is to compare outcomes of children receiving UFSM with a prediction of what their
outcomes would have been had the UFSM schemes never been introduced. The key assumption in both methods
used is of parallel trends: that the change in outcomes in the LAs that never introduced UFSM is a good guide to
what the change would have been in the LAs that did.
Our bodyweight analysis controls for the presence of a universal school breakfast scheme, the timing of measurement (academic year and half-term within each year), and interactions of this timing with the proportion of children measured who are girls or of Black ethnicity, the school’s quintile of the Income Deprivation Affecting Children Index, and a School Fixed Effect. We compare schools in treated areas with the rest of England, weighted to have the same profile in terms of observable characteristics.
In our food expenditure analysis we estimate the impact of an additional child in the household being eligible for UFSM, based on their age and LA of residence, on equivalised real expenditure (adjusting for household size) on (i) supermarket food and groceries; (ii) eating out and takeaways, and (iii) the total of these. We control for timing of interview, household
structure, income, employment, housing situation and party-political control of the local council, public health spending, population density and prevalence of fast food outlets in the LA.
Results for children’s bodyweights
Table 1 shows the average bodyweight outcomes in schools in Local Authorities that did and did not run UFSM schemes for the time-period of academic years-ending 2007-2009, before the schemes were introduced.
| 1990 UK pop | 2007-09 UFSM LAs |
2007-09 Never – UFSM LAs |
|
|---|---|---|---|
| Overweight or obese, % | |||
| Reception | 15.0 | 25.9 | 22.8 |
| Year 6 | 15.0 | 35.9 | 32.2 |
| Obese, % | |||
| Reception | 5.0 | 13.9 | 9.7 |
| Year 6 | 5.0 | 24.9 | 17.9 |
Table 1 Baseline period bodyweight outcomes
Note Source of 2007-09 figures: National Child Measurement Programme. UK 1990 population proportions and z-score take these values by definition.
Reception and Year 6 children in LAs that went on to introduce UFSM schemes had a somewhat higher prevalence of overweight and obesity than those that did not. Children in schools everywhere had considerably higher bodyweights than children in 1990, shown for comparison in the first column.
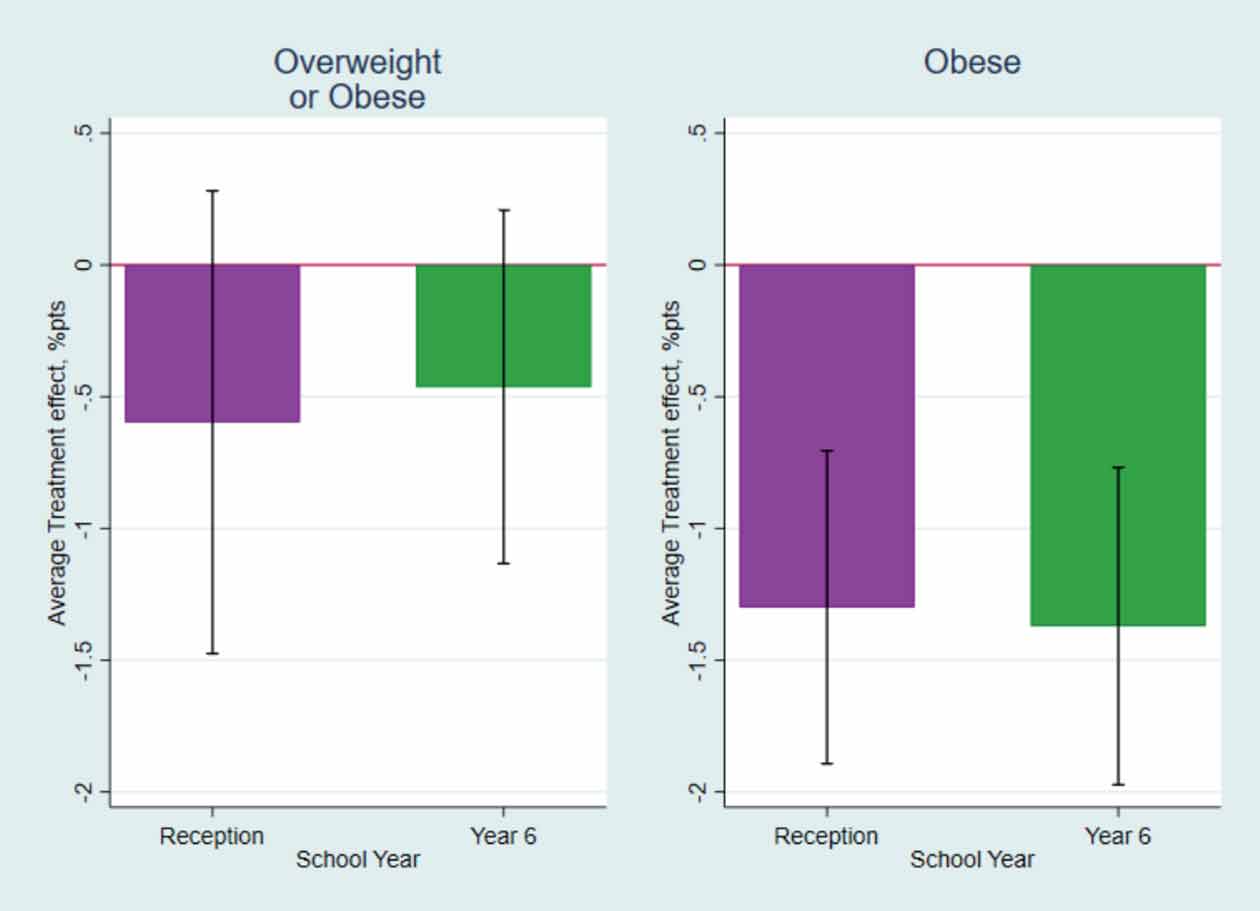
Estimates of the average impact of Universal FSM for Reception and Year 6 children are shown in the purple and green bars in Figure 1, with the capped lines indicating 95% confidence intervals for the true effect.
UFSM reduces the prevalence of obesity among children by 1.3-1.4 percentage points in both Reception and Year 6. The effect is proportionally larger in Reception, where the baseline prevalence of obesity is 14%, against 25% in Year 6.
The impact on children being overweight or obese is smaller and cannot be statistically distinguished from zero. The larger effects at the threshold of obesity rather than overweight suggest that more of the impact is on children towards the top of the bodyweight distribution.
Note Source: National Child Measurement Programme. Pooled schooland-year fixed-effect regression with separate treatment indicators for each duration of exposure.
However, when we split the analysis by the average bodyweight in schools, measured in 2007-2009 before UFSM were introduced, we find much smaller effects for schools with high (above-median) obesity, i.e. where obesity is more entrenched (see left panel of Figure 2). This could be because the school and home environment around high-obesity schools is less conducive to losing weight.
We also split the analysis into the top fifth ‘poorest’ schools, measured according to the number of students registered for FSM in 2009, and the less disadvantaged schools (right panel of Figure 2).
Despite schools with a high proportion of FSM eligible children having less scope to increase take-up of free meals under the LA scheme (as these children are always eligible), there is no discernible pattern of differences in the impacts between poorer and richer schools. This could be explained by FSM eligible students newly taking up free meals once they become free for all students, or the impact on bodyweight being much larger for students in poorer schools.
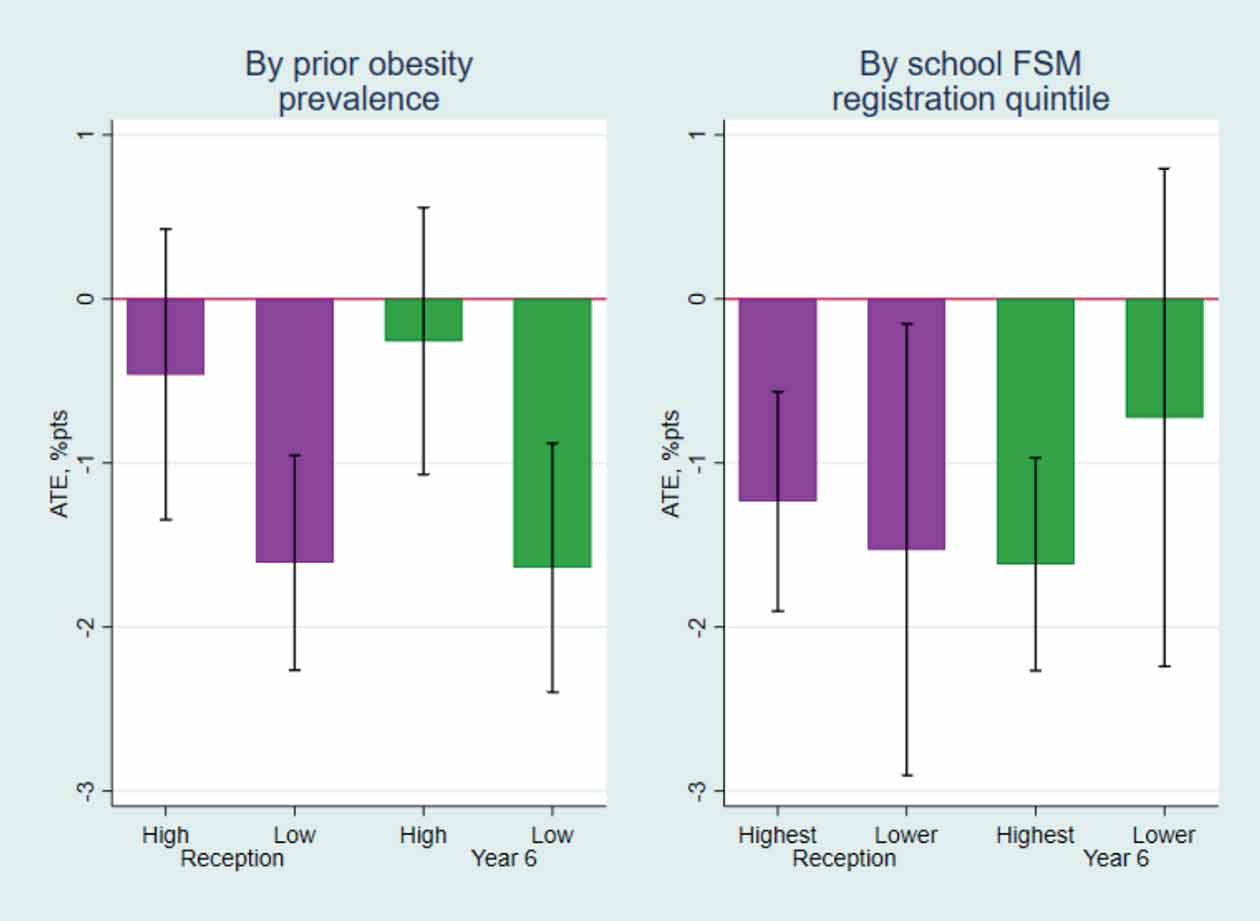
Note Source: National Child Measurement Programme, Borusyak, Jaravel & Spiess imputation method applied separately to each distinct population. Reception analysis excludes academic years-ending 2015 onwards due to national UIFSM.
We also look at the impact of receiving UFSM for different durations. All children weighed and measured in Reception had received UFSM for less than one academic year. For Year 6 children this depends on how long the LA had been providing UFSM. Some could be receiving UFSM for the first time in Year 6, others could have received it throughout primary
school (for 7 years).
Figure 3 shows estimated treatment effects on Year 6 children by duration of exposure. Estimates are less precise here because there are fewer school years of data for each duration. This means few individual treatment effects or differences between them are statistically significant.
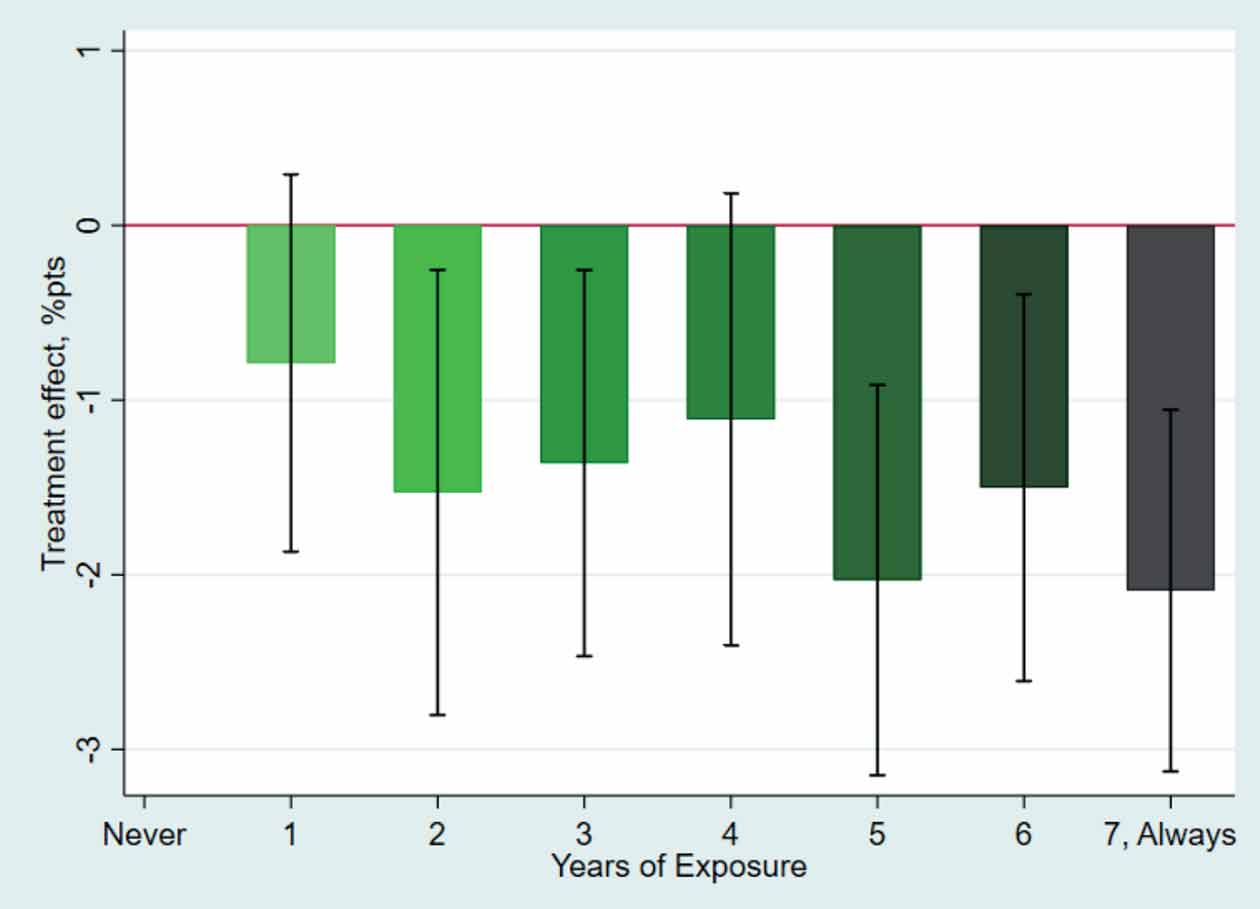
Note Source: National Child Measurement Programme. Pooled schooland-year fixed-effect regression with separate treatment indicators for each duration of exposure.
Nonetheless, the figure shows a relationship where the impact of UFSM is the smallest for Year 6 receiving UFSM
for the first time and largest for children who have been exposed to UFSM throughout primary school, suggesting
the impact of UFSM on obesity rates is cumulative, i.e. it adds up over time.
Newly receiving free meals in Year 6 has a smaller effect than newly receiving them in Reception. This indicates that the bodyweights of older children are harder to shift in the short term. This could be because school meals comprise a smaller proportion of older children’s total energy intake, or perhaps due to older children having more autonomy over what they eat outside of school.
Results for household food expenditure
Table 2 shows the estimated savings to household expenditure for families in LAs that ran UFSM schemes. We distinguish households of different sizes and with different numbers of eligible children. A single- parent household with one eligible child saved £11.47 in food expenditure per month, while a two-parent household with two eligible children saved £37.04.
Just under half the savings are on eating out and the rest on supermarket food shopping. The reduction in expenditure on eating out equates to approximately 10% of money spent eating out, proportionally much larger than the reduction in supermarket expenditure, of approximately 3%.
The total reduction is expenditure is always worth less than the market value of UFSM, listed in the last column. This means households in receipt of UFSM are consuming
a higher value of food in total.
| Supermarket food (1) | Eating out and takeaways (2) | Total (1)+(2) | Market value of UFSM* | |
|---|---|---|---|---|
| One UFSMeligible child in a one parent, one child family | -£6.20 | -£5.47 | -£11.47 | £34.50 |
| Two UFSM eligible children in a one parent, two child family | -£15.27 | -£13.46 | -£28.23 | £69.00 |
| One UFSM eligible child in a two parent, two child family | -£10.02 | -£8.83 | -£18.52 | £34.50 |
| Two UFSM eligible children in a two parent, two child family | -£20.04 | -£17.67 | -£37.04 | £69.00 |
| Sample size | 46,765 | 46,768 | 46,582 |
Table 2 Impacts of Universal FSM on household food expenditure in last four weeks
Note Source: UKHLS Waves 1-11. Figures are real, 2015 pounds. For each outcome, effects for households of different structures obtained from single regression for equivalised expenditure. *£2.30 x 5 days a week x 4 weeks x number of children x 39/52 (proportion of weeks at school rather than holiday).
- McKinsey Global Institute (2014). Overcoming obesity: An initial economic analysis.
- Davies, S. (2019). Time to Solve Childhood Obesity: An Independent Report by the Chief Medical Officer.
- Holford, A. and Rabe, B (2022). ‘Going universal. The impact of free school lunches on child body weight outcomes’, Journal of Public Economics Plus, Volume 3, 2022, 100016. https://doi.org/10.1016/j.pubecp.2022.100016.
- Borusyak K., Jaravel, X. and Spiess J. (2022). Revisiting Event Study Designs: Robust and Efficient Estimation. https://arxiv.org/abs/2108.12419
Acknowledgements
The Nuffield Foundation has funded this project, but the views expressed are those of the authors and not necessarily the Foundation. Visit www.nuffieldfoundation.org. The authors acknowledge additional support from the ESRC Research Centre on Micro-Social Change [ES/S0124861]. This work uses data from the National Child Measurement Programme, supplied by NHS Digital, also known as the Health and Social Care Information Centre. The use of NHS Digital statistical data in this work does not imply the endorsement or quality assurance of NHS Digital in relation to the interpretation or analysis of the statistical data. Research datasets may not exactly reproduce National Statistics aggregates.
Cite
Holford, A. and Rabe B., (2022) Impacts of Local Authority Universal Free School Meal schemes on Child Obesity and Household Food Expenditure, MiSoC Explainer. DOI: https://doi.org/10.5526/misoc-2022-003
The final report from this project will be published in due course at
www.iser.essex.ac.uk/research/projects/impacts-of-the-universal-free-school-meal-in-England © ISER September 2022
1 McKinsey Global Institute (2014). Overcoming obesity: An initial economic analysis.
2 Davies, S. (2019). Time to Solve Childhood Obesity: An Independent Report by the Chief Medical Officer.
3 Holford, A. and Rabe, B (2022). ‘Going universal. The impact of free school lunches on child body weight outcomes’, Journal of Public Economics Plus, Volume 3,
2022, 100016. https://doi.org/10.1016/j.pubecp.2022.100016.
4 Borusyak K., Jaravel, X. and Spiess J. (2022). Revisiting Event Study Designs: Robust and Efficient Estimation. https://arxiv.org/abs/2108.12419
© ISER September 2022